Introducing Performance Chart📈
Feb 9, 2023
More than the classic standings
When did your team hit the highest and lowest peaks during the season?
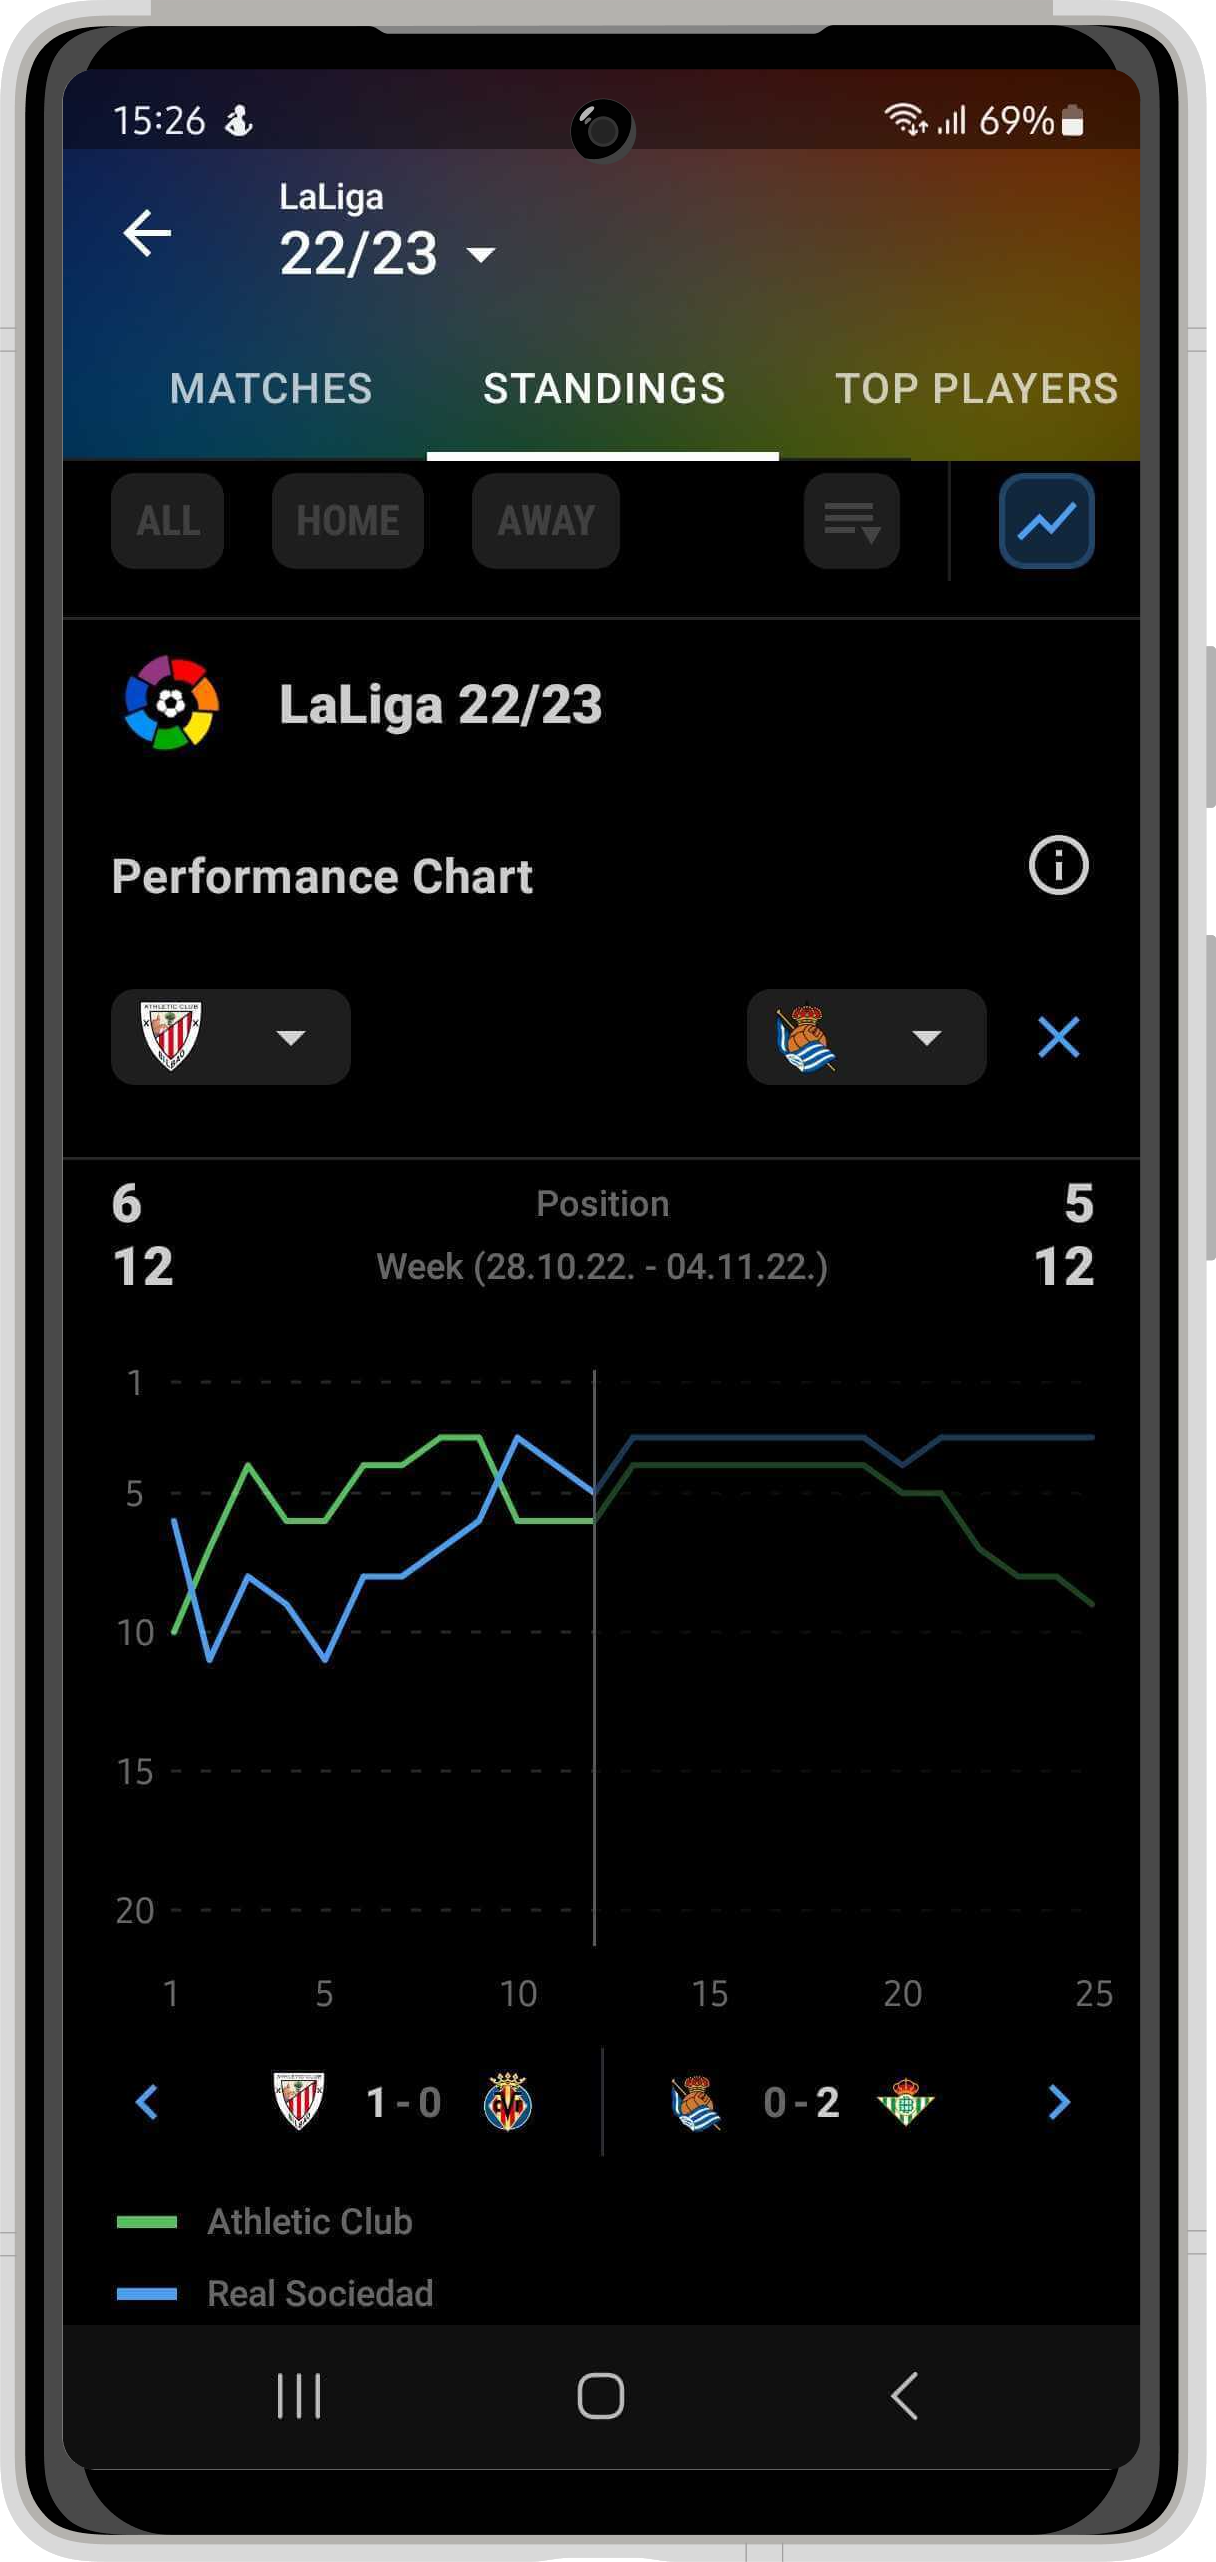
How’s your team performing compared to its rival?
Is your team’s opponent on an upward or downward path for the upcoming matchday?
These are just a few questions that can be answered by exploring our newest feature: the Performance Chart!
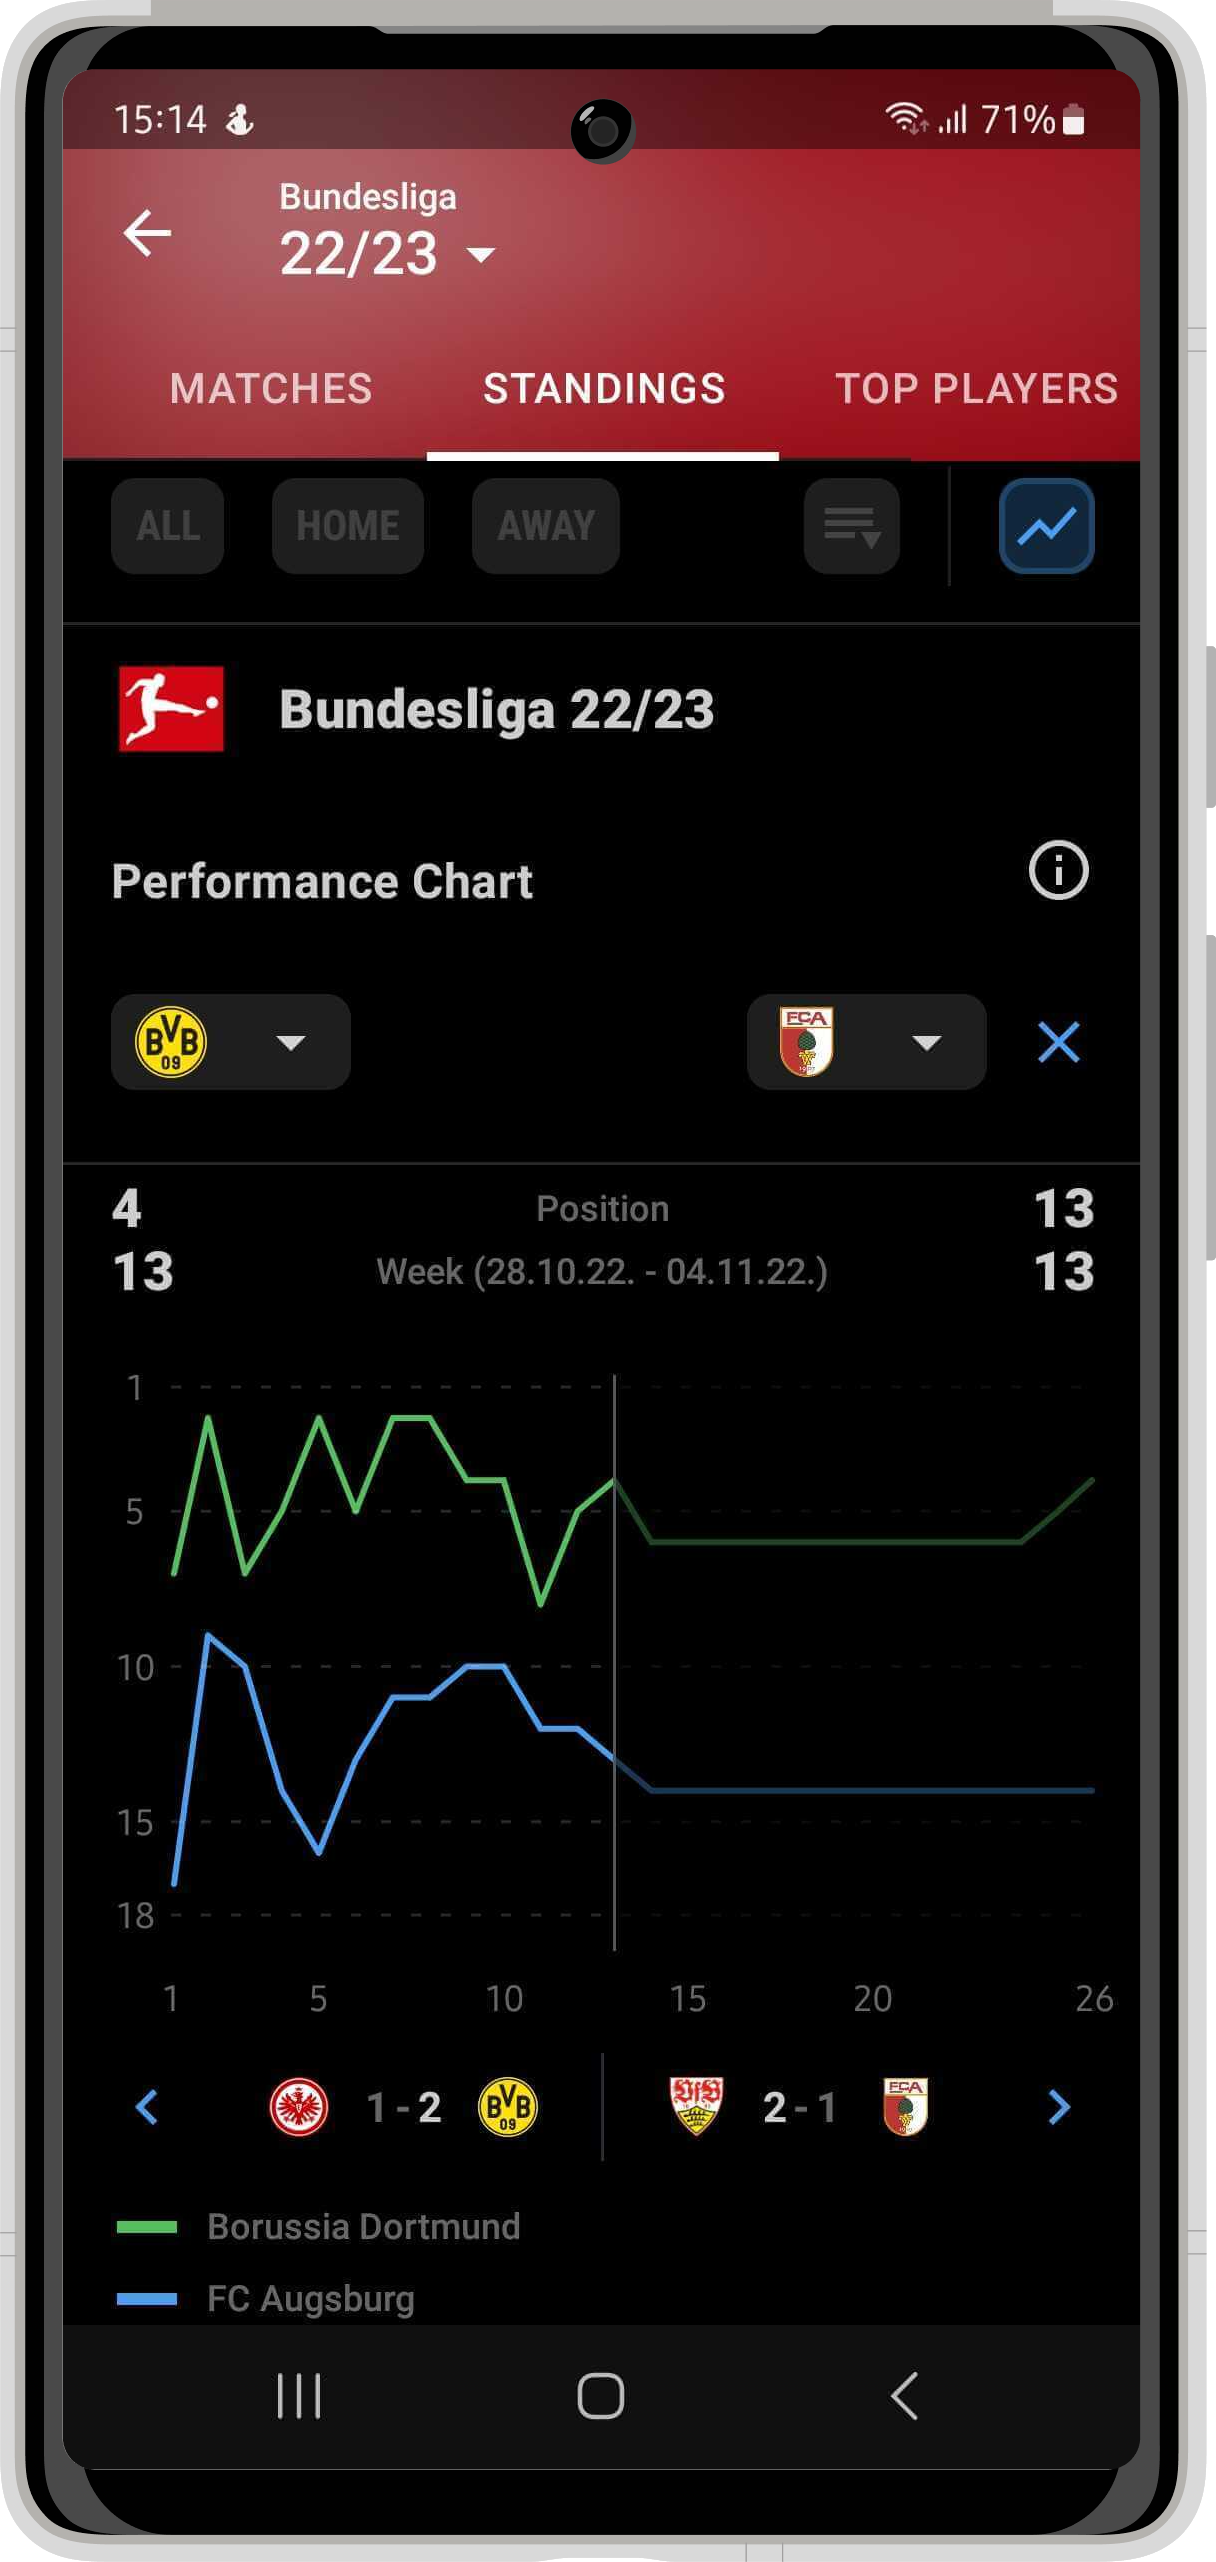
Performance Chart gives you a different perspective on the team’s previous or current form compared to the classic standings format. The chart visualizes all of the team’s matches to date and shows you through the timeline how the team’s position changed (or remained the same) from the start to the finish of the season.
Where can you find it?
There are many ways to access the chart. It’s just an easy tap on the button with the chart icon on the Standings tab. However, accessing the chart from different places in the app will give you a different starting point of view:
 Access from the Standings tab within the selected competition
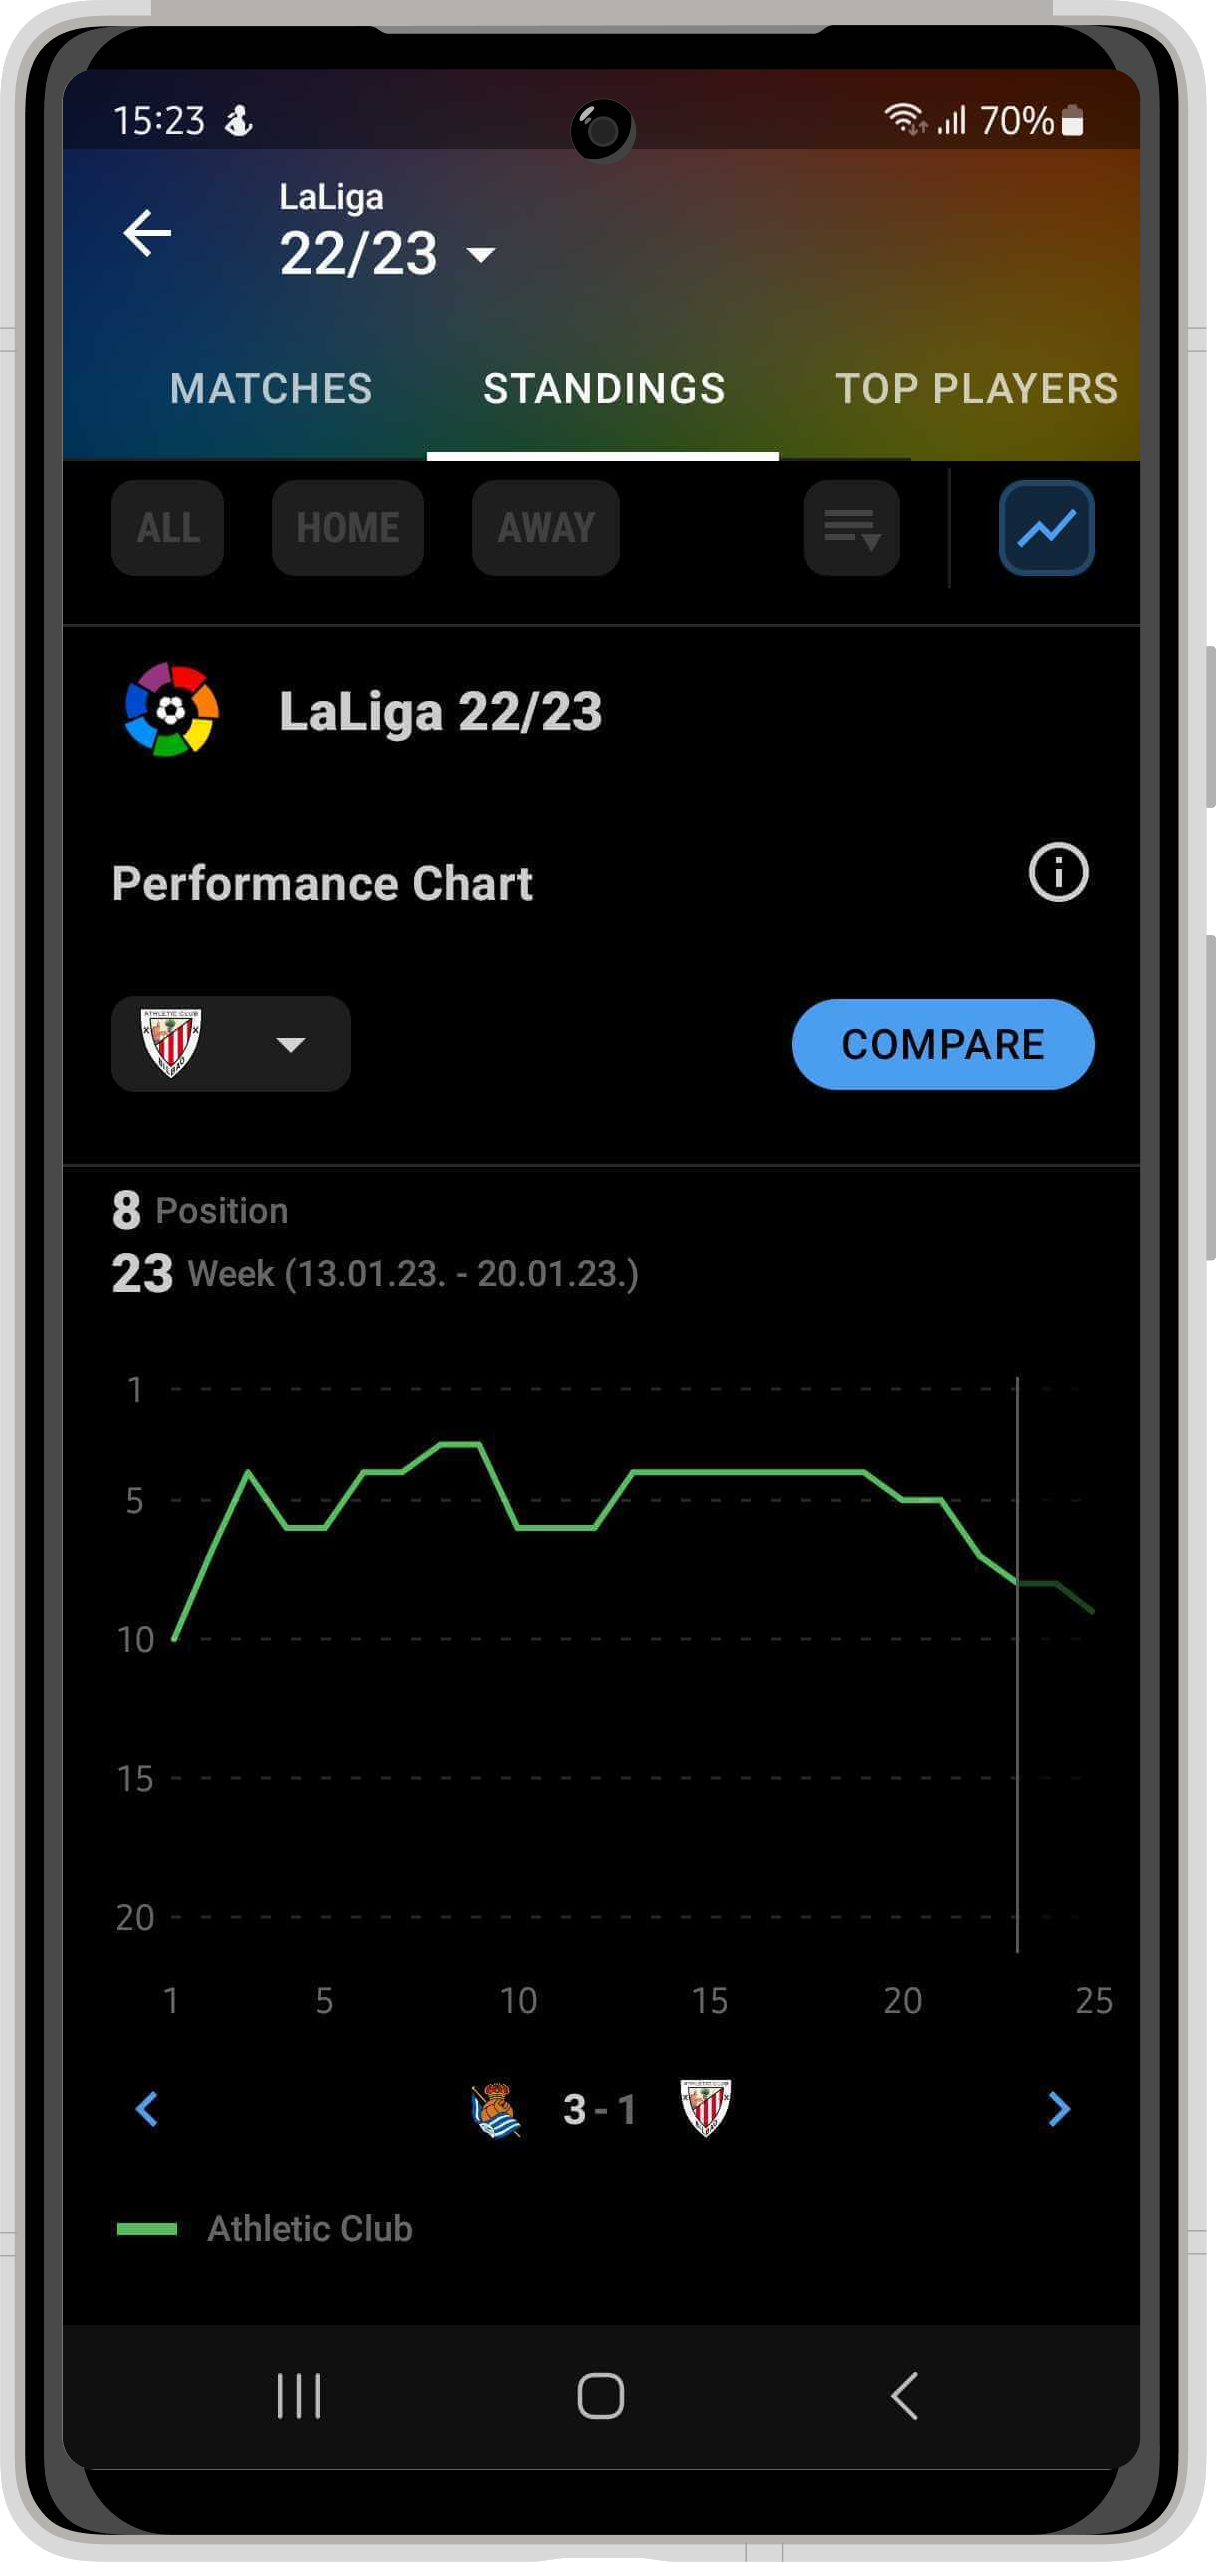
 Access from the Standings tab within the team
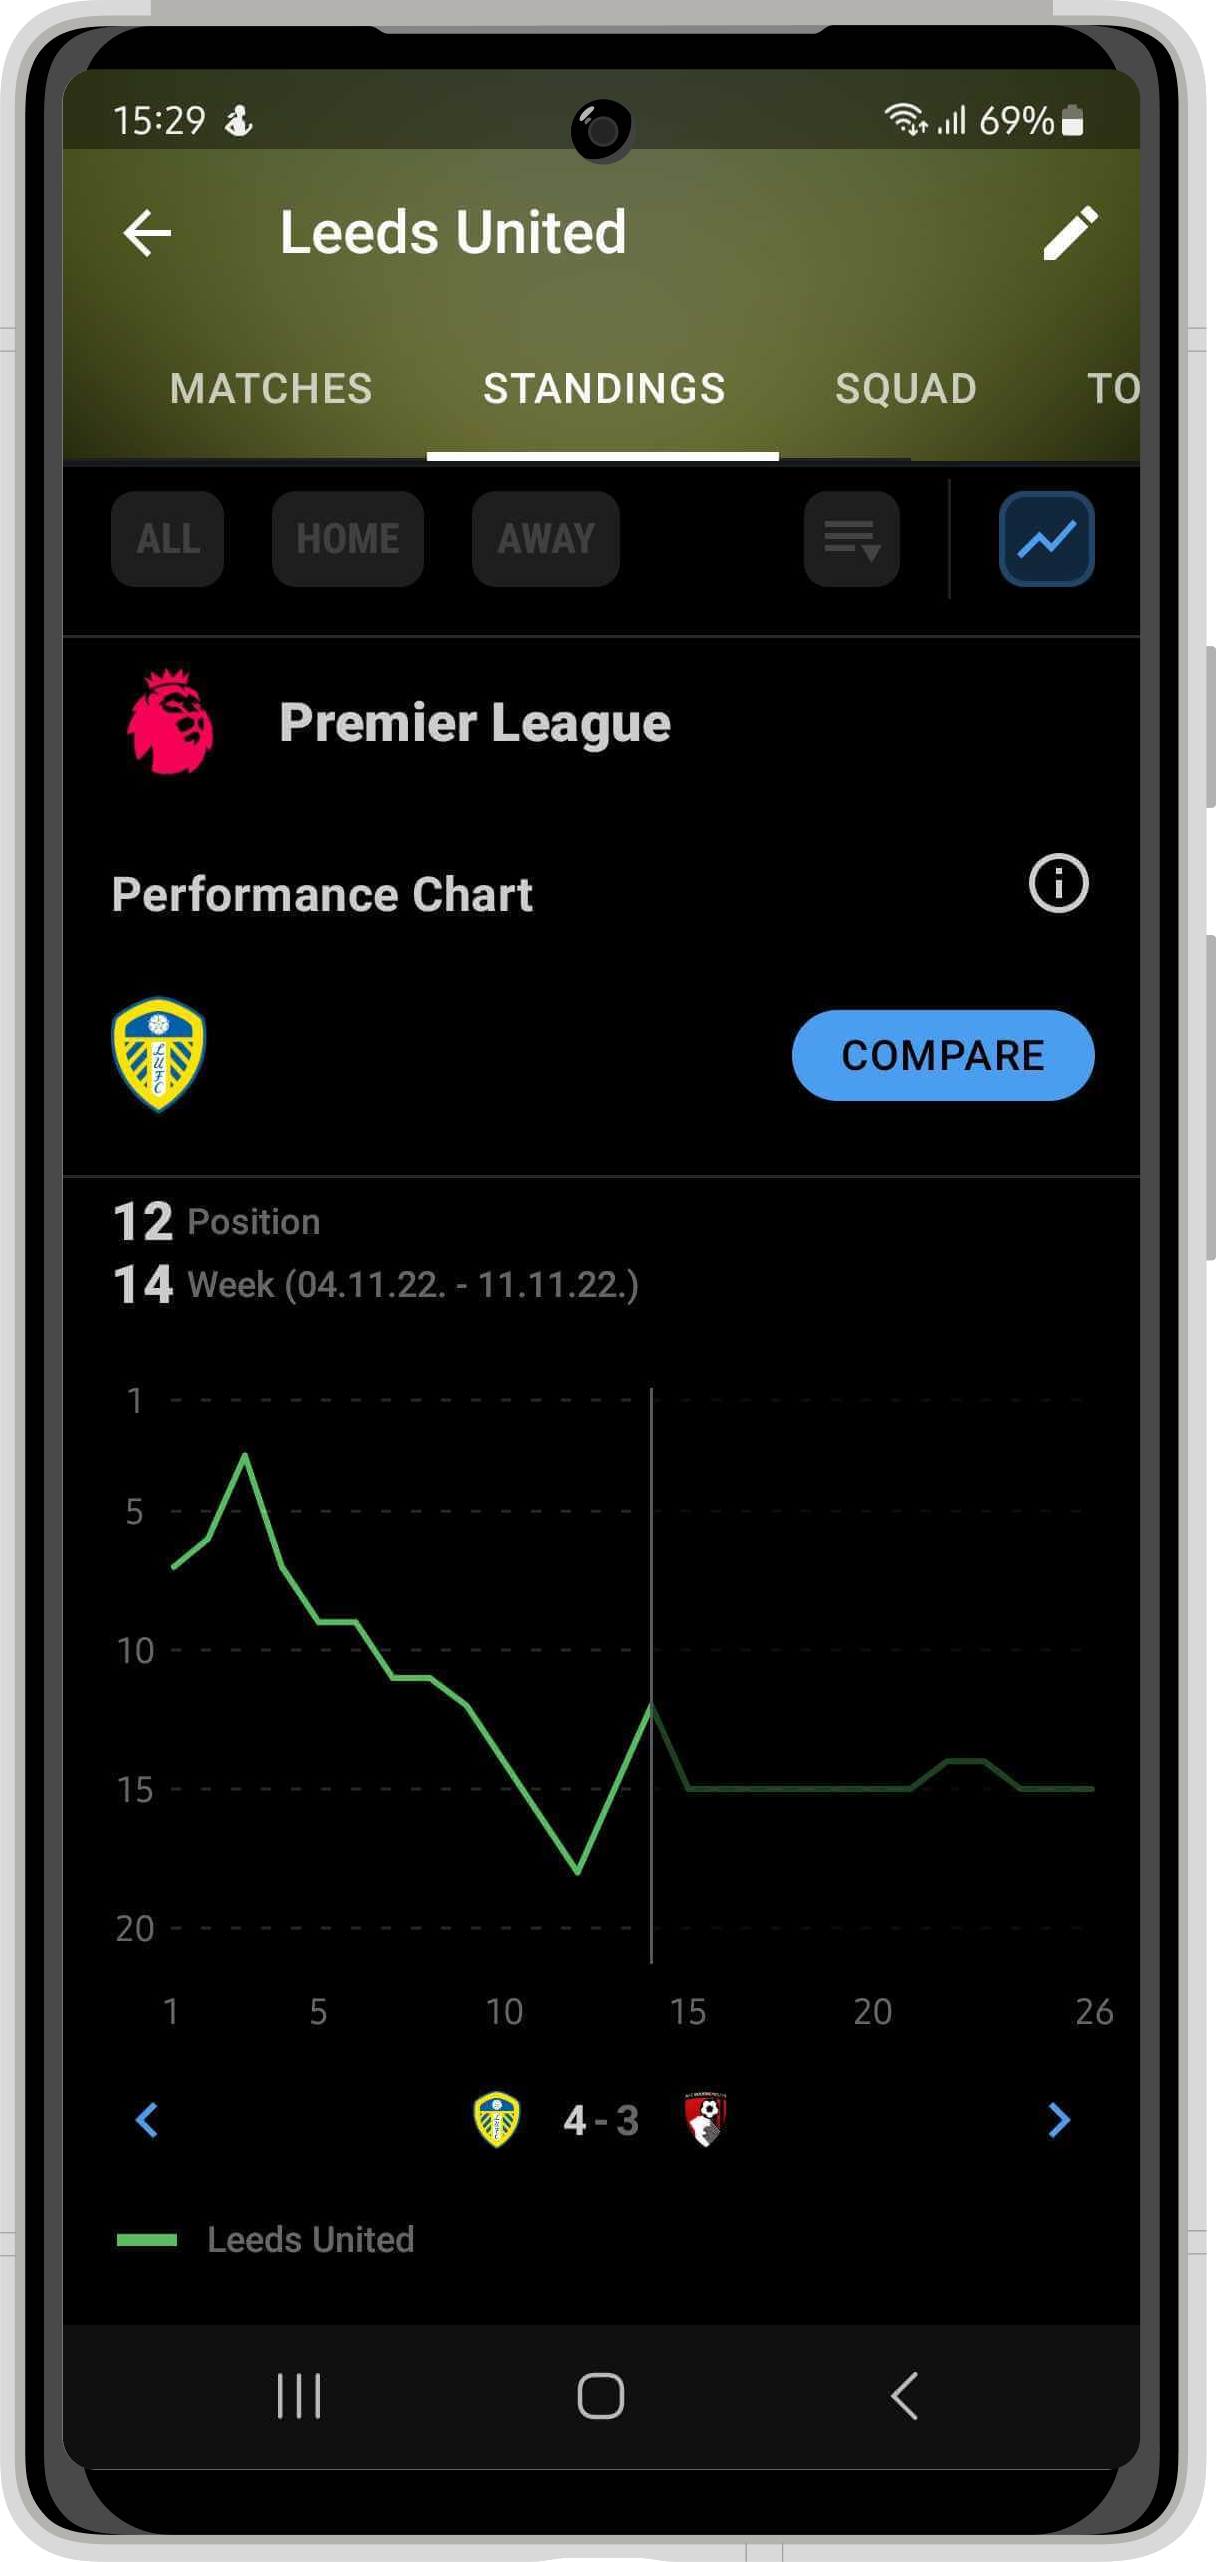
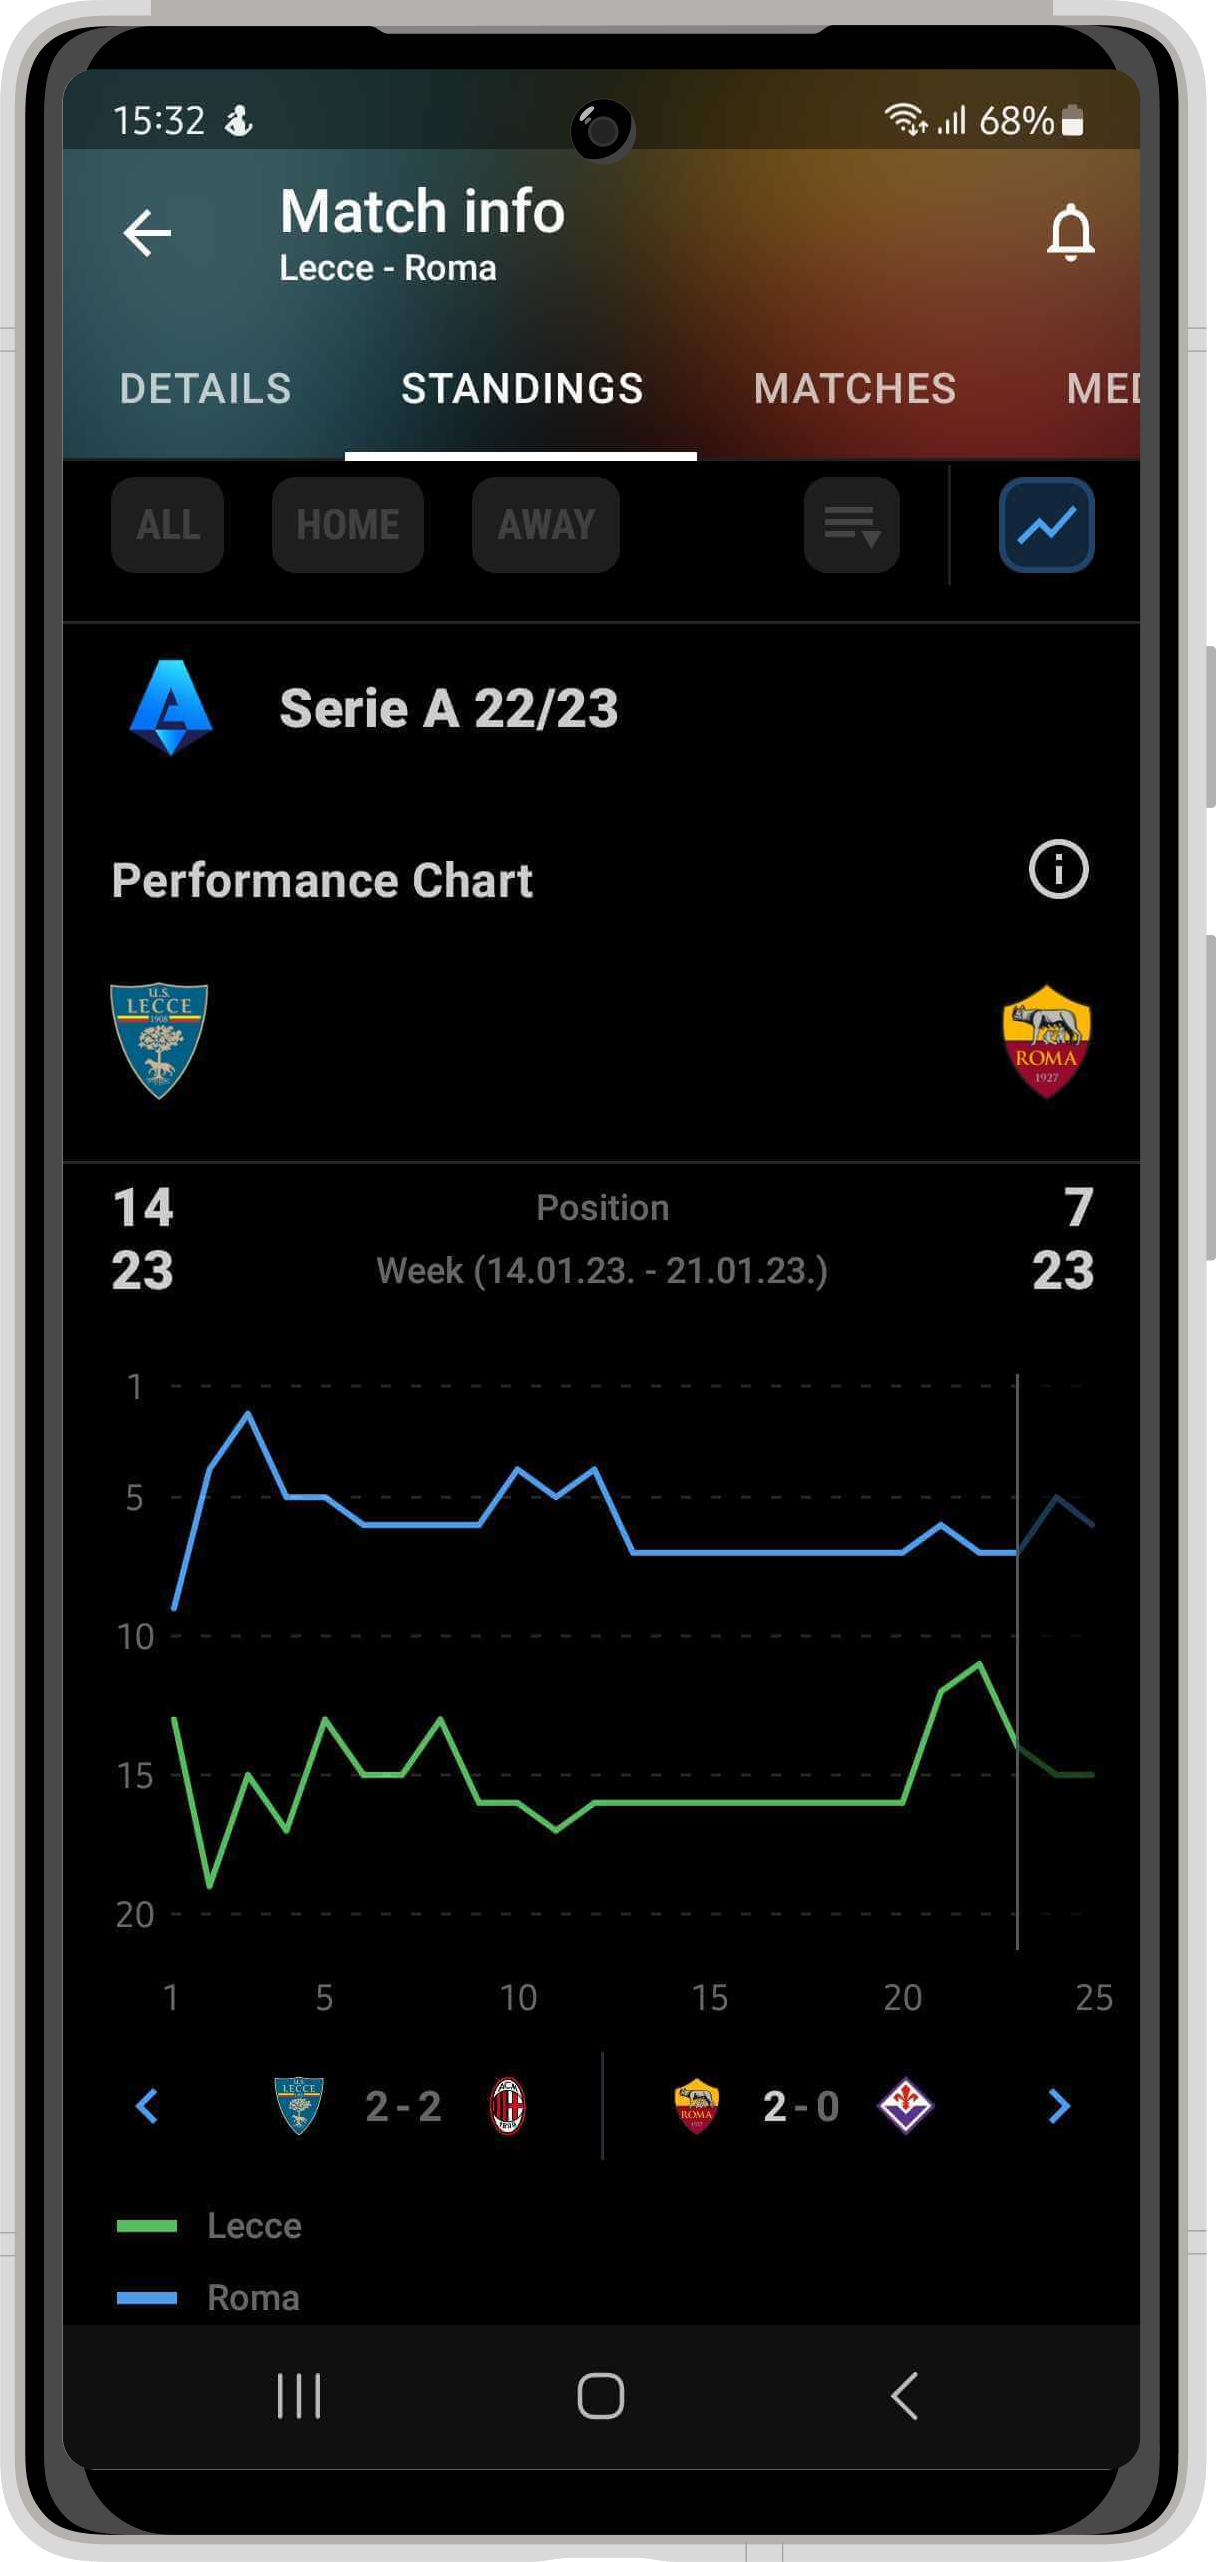 Access from the Standings tab within the selected match
Explore the chart
Select different teams and leagues. Analyse and compare your favorites and rivals by moving on the chart. Once you get familiar with this feature, there’s no doubt it will give you a broader and deeper understanding of current or previous league standings and team performances.
To properly explore and embrace the value of the Performance Chart, ensure your app is up to date!
